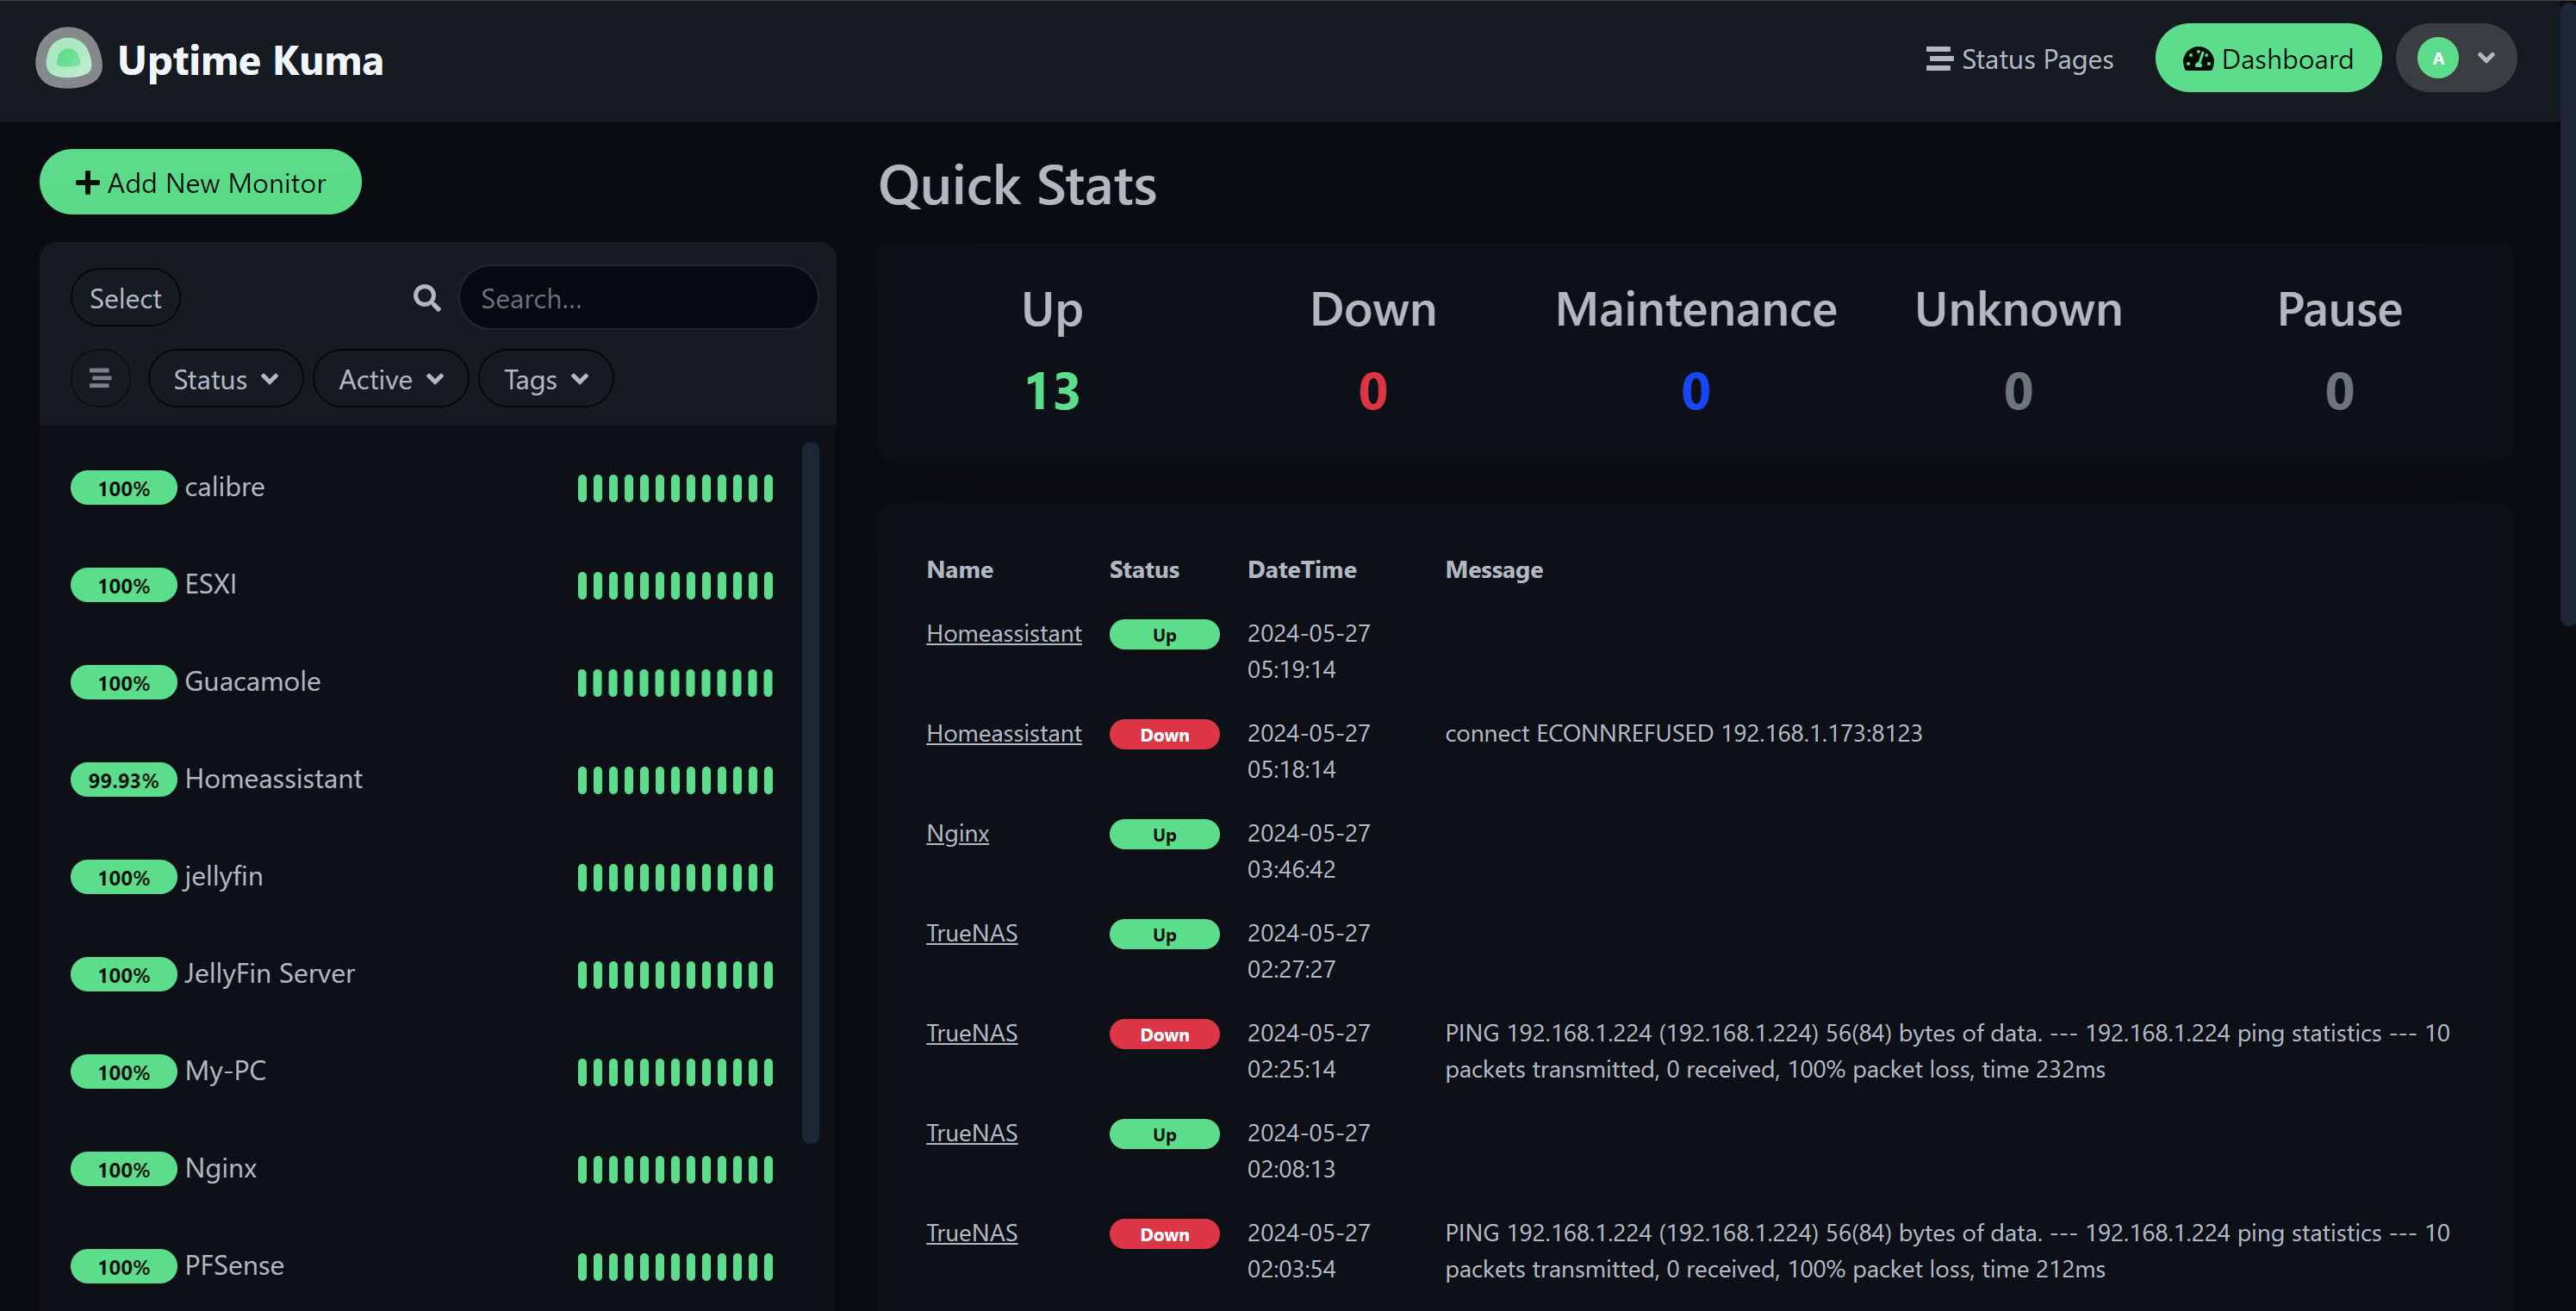
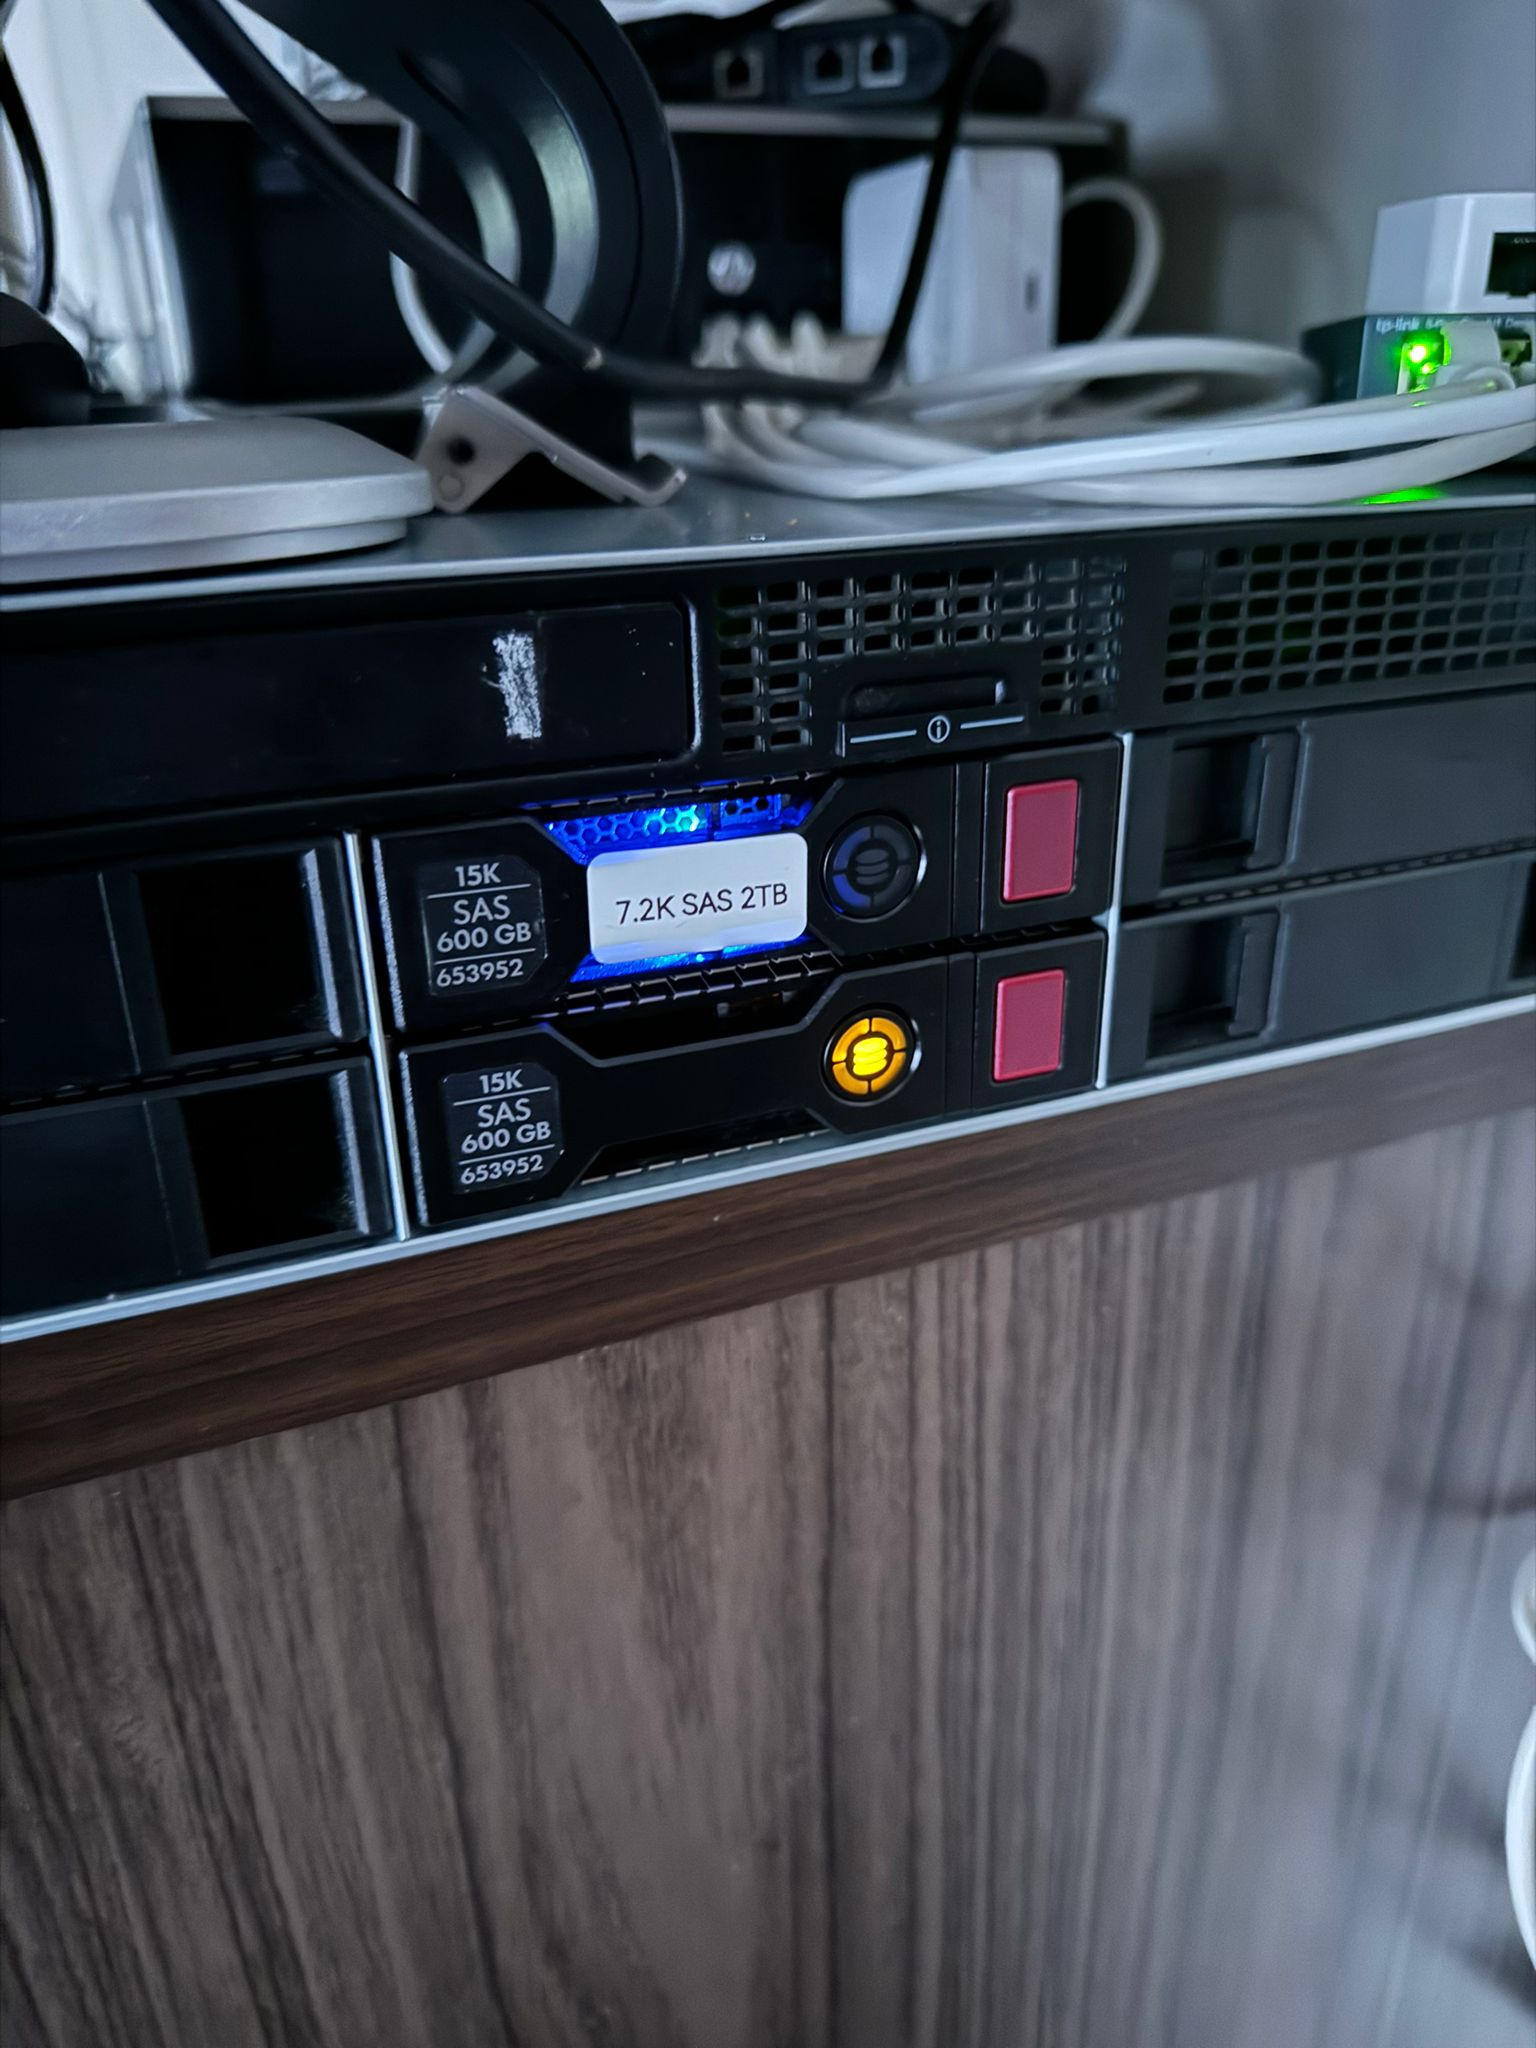
n today’s world, where our digital lives are intertwined with various services, ensuring the seamless operation of these services is crucial. Whether you’re managing a home server running Jellyfin for your media, Nginx for your web services, or any other self-hosted applications, maintaining visibility over their uptime and performance is essential. This is where monitoring tools come into play. In this post, we’ll explore how to use Uptime Kuma along with other network monitoring tools to keep an eye on your running services.
What is Uptime Kuma?
Uptime Kuma is a self-hosted monitoring tool that allows you to track the uptime and performance of your services. It offers a user-friendly interface and flexible notification options, making it a perfect choice for monitoring internal services.
Setting Up Uptime Kuma
- Installation:
- Docker: The easiest way to install Uptime Kuma is via Docker. You can pull the Docker image and run it with the following command:bashCopy code
docker run -d --restart=always --name uptime-kuma -p 3001:3001 louislam/uptime-kuma:1 - Direct Installation: Alternatively, you can install it directly on your server. Instructions for this method can be found in the Uptime Kuma GitHub repository.
- Docker: The easiest way to install Uptime Kuma is via Docker. You can pull the Docker image and run it with the following command:bashCopy code
- Configuration:
- Access the Uptime Kuma web interface by navigating to
http://your-server-ip:3001. - Create an admin account and log in.
- Start adding your services to monitor. For example, you can add Jellyfin and Nginx by specifying their URLs and selecting the appropriate monitoring type (HTTP(s), TCP, Ping, etc.).
- Access the Uptime Kuma web interface by navigating to
Monitoring Jellyfin
Jellyfin is an open-source media server that allows you to stream your media files. To monitor Jellyfin using Uptime Kuma:
- Add a New Monitor:
- Click on “Add New Monitor”.
- Select “HTTP(s)” as the type.
- Enter the Jellyfin URL (e.g.,
http://your-server-ip:8096). - Configure the monitoring interval and alert settings.
- Save the monitor.
- Alerts:
- Set up notifications through various channels like email, Telegram, or Discord to get alerted if Jellyfin goes down.
Monitoring Nginx
Nginx is a powerful web server that is often used as a reverse proxy. To monitor Nginx:
- Add a New Monitor:
- Click on “Add New Monitor”.
- Select “HTTP(s)” and enter the URL of your Nginx server (e.g.,
http://your-server-ip). - Configure the necessary settings, such as monitoring intervals and expected response codes.
- Save the monitor.
- Custom Health Checks:
- You can set up custom health checks by pointing to a specific health check endpoint that you have configured on your Nginx server.
Using Other Network Monitoring Tools
While Uptime Kuma provides an excellent overview of uptime and basic performance metrics, other tools can complement it by offering deeper insights:
- Prometheus and Grafana:
- Prometheus: A powerful monitoring and alerting toolkit that collects and stores metrics.
- Grafana: An open-source platform for monitoring and observability, perfect for visualizing data from Prometheus.
- You can set up Prometheus to scrape metrics from your services and use Grafana to create dashboards for a comprehensive view.
- Netdata:
- Netdata provides real-time performance monitoring and visualization for systems and applications. It’s particularly useful for tracking detailed system metrics.
Integrating Tools for Comprehensive Monitoring
To achieve a comprehensive monitoring setup:
- Combine Uptime Kuma with Prometheus:
- Use Uptime Kuma for uptime and basic performance monitoring.
- Set up Prometheus to collect detailed metrics and Grafana to visualize these metrics.
- Use Netdata for Real-Time Insights:
- Install Netdata on your servers to monitor CPU, memory, disk usage, and network traffic in real-time.
Conclusion
Monitoring your internal services is essential to ensure their reliability and performance. Uptime Kuma provides a straightforward way to monitor uptime, while tools like Prometheus, Grafana, and Netdata offer deeper insights into system and application performance. By integrating these tools, you can create a robust monitoring setup that keeps you informed about the status of your services, such as Jellyfin and Nginx, ensuring they are always running smoothly.
Keep an eye on your services and be proactive in addressing any issues that arise, ensuring a seamless experience for you and your users.
4o


